
Imagine if your Computer’s CPU had a tiny dashboard light that screamed, “I’m overheating! Pull over!” Unfortunately, our PCs aren’t equipped with those warning lights, so keeping an eye on your CPU temperature is crucial—especially when you’re pushing it to the limit with intensive tasks like gaming, video editing, or running multiple programs.
Your CPU is the brain of your computer, and keeping it cool is crucial for its longevity and performance. I’ve spent years testing various monitoring methods and know exactly what works and what doesn’t in Windows 11
In this guide, I will give all the quick and easy ways to check your CPU temperature in Windows 11. From built-in methods like PowerShell and BIOS readings to advanced monitoring software. You’ll learn which method works best for your needs, whether you’re a casual user or a performance enthusiast.
You’ll discover everything from simple built-in tricks to advanced monitoring software like Core Temp, HWiNFO, and AIDA64.
Ready to keep your CPU running at optimal temperatures? Let’s dive into the methods, starting with the simplest built-in options and moving to more advanced monitoring tools.
For more understanding on how to improve Windows 11 performance you can refer How to Speed Up Windows 11
Table of Contents
Built-in Windows 11 Methods to Check CPU Temperature
While Windows 11 has plenty of built-in tools for monitoring your system’s performance, checking your CPU temperature isn’t as straightforward. But there are still a few tricks that can help you get an idea of how your PC is holding up, even without third-party apps.
But before that, I had a widespread misconception that I needed to clear.
Myth: Task Manager show’s CPU temperature.
When you think of monitoring your PC’s performance, the first tool that comes to mind is usually Task Manager. After all, it provides real-time stats on everything from CPU usage to memory consumption. But here’s the kicker: Task Manager does not show CPU temperature on Windows 11. A common misconception is that it should, given how much else it displays, but unfortunately, it just isn’t equipped for that.
So why mention it?
It’s important to address this myth because many users spend unnecessary time searching for the temperature in Task Manager, only to be disappointed. Task Manager can show you helpful stats like your CPU usage percentage, memory, disk usage, and more—but temperature monitoring isn’t one of them. If you were hoping to find it here, you’ll need to look elsewhere.
So, if our intended Task Manager is not capable of providing us the CPU temp info, then how are we supposed to check if our CPU is not running hot and that without using any third-party app?
Well, there are two ways.
1. Check CPU Temperature in Windows 11 Using Windows PowerShell Commands
While Windows doesn’t offer a flashy built-in temperature monitor, you can still try your hand at using Windows PowerShell to check CPU temperature. But fair warning, this method might not always give you the most reliable results. Let’s walk through the steps.
- Right-click on the Start button (Windows logo) in the lower-left corner of your screen. From the menu that pops up, select Terminal (Admin).
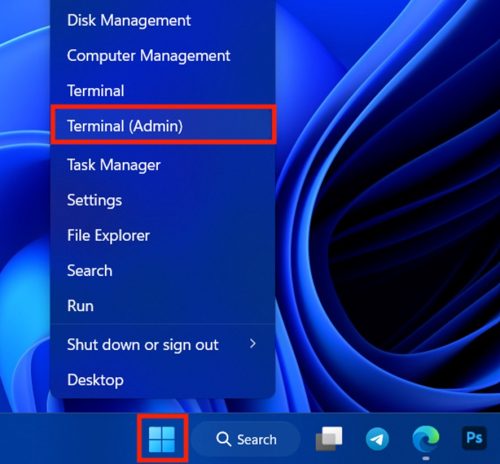
You can also search for Windows PowerShell and run it with administrative rights. Both options work similarly. I am using Windows Terminal here for demonstration.
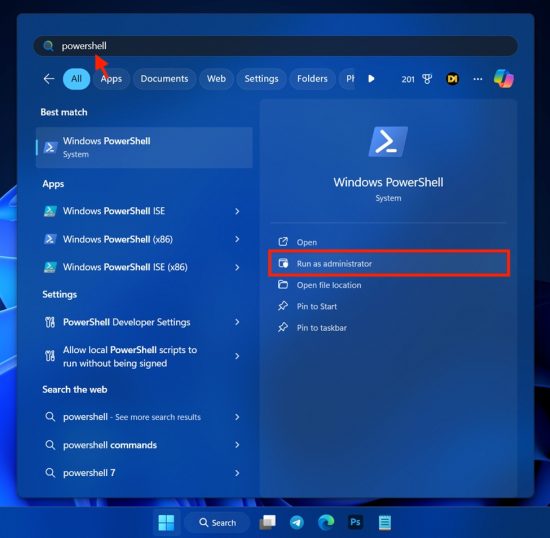
This will open a command-line interface where you can type commands. Don’t be intimidated; it’s easier than it looks!
- In the PowerShell window, type or copy and paste the following command:
Get-WmiObject MSAcpi_ThermalZoneTemperature -Namespace “root/wmi”
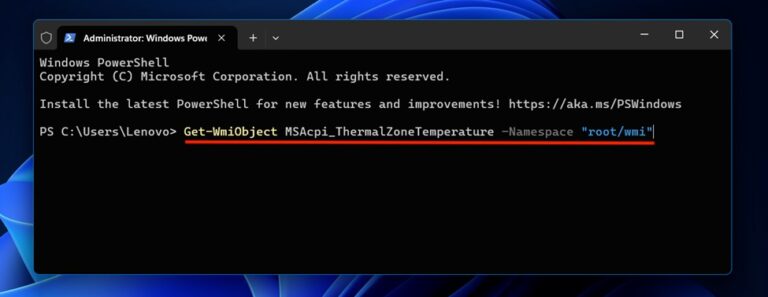
This command queries the Windows Management Instrumentation (WMI) to get temperature readings from your system. Once you hit Enter, PowerShell will attempt to fetch your CPU temperature.
At this point, you may either see a temperature reading next to CurrentTemperature or get nothing useful, as the accuracy of this command can vary depending on your hardware.
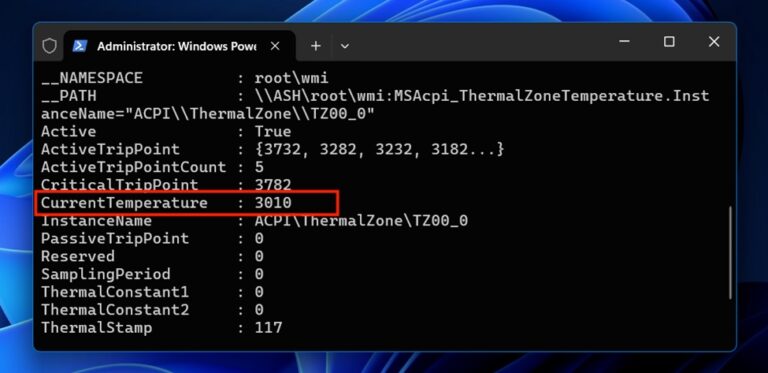
Many users report that it doesn’t always work on all Windows 11 systems, but it’s still worth a shot. If you’re lucky, it’ll give you a basic readout of your CPU’s current temperature.
2. Checking BIOS/UEFI Temperature Readings
For a more reliable and precise way to check your CPU temperature, you’ll need to go straight to the source: your PC’s BIOS or UEFI settings.
This method involves rebooting your machine, but it’s one of the most accurate ways to monitor your system’s health without needing to install any extra software. Let’s dive into it.
- Click the Start button and open the Settings app. Alternatively, you can press the Win + I key combination on your keyboard to quickly open the Windows Settings app.
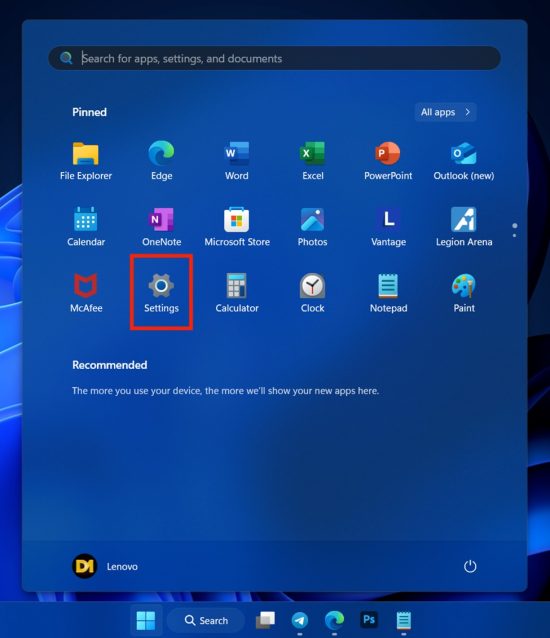
- In the settings app, switch to the System tab to open the system settings. Scroll down a bit and click on the Recovery option. This will open the Windows System Recovery settings.
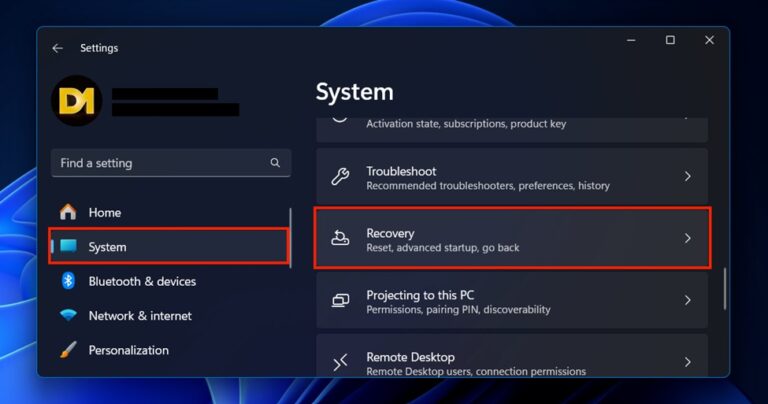
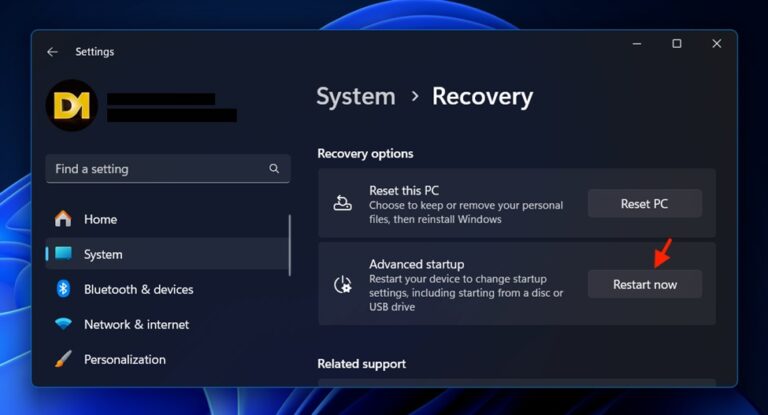
- Now, locate the Advanced startup option and click on the Restart Now button.
As soon as you hit the Restart Now button, your Windows 11 PC will restart into the Windows Startup settings screen.
- You’ll now be on a blue Windows Startup settings screen. Here, click on the Troubleshoot option. This will take you to a menu with the startup troubleshooting options.
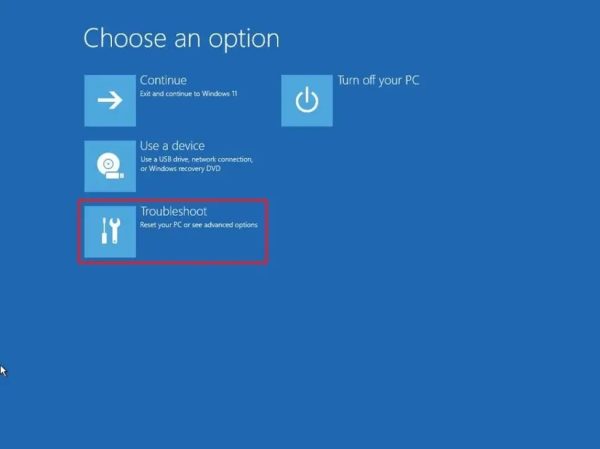
- From the startup troubleshooting options, select Advanced options to get the actual option to boot into the system BIOS.
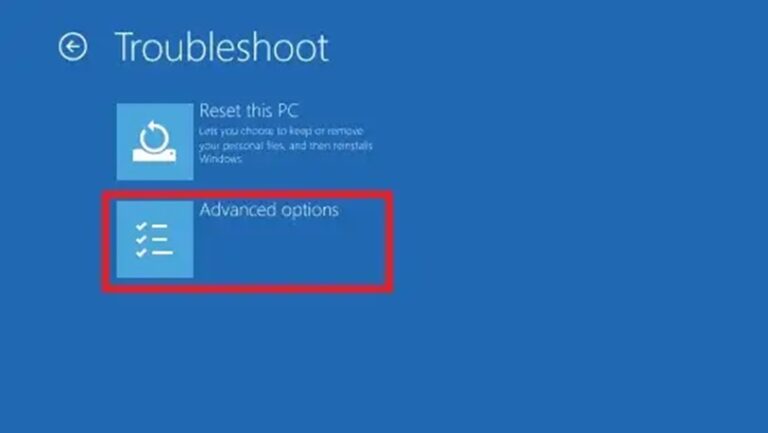
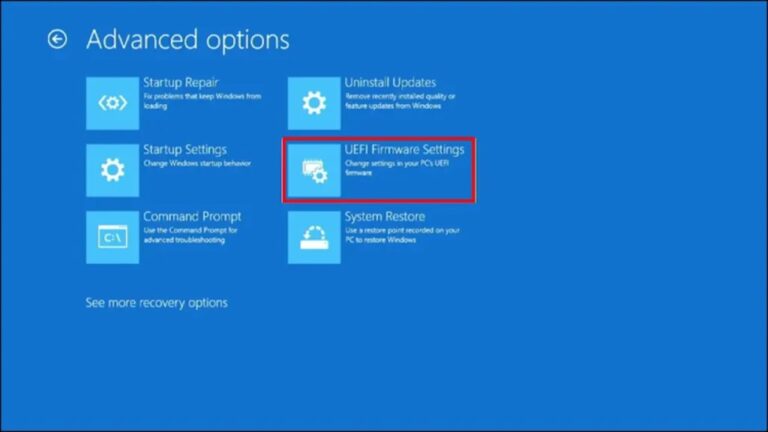
- From the Advanced options menu, click on UEFI Firmware Settings. This is what we commonly call system BIOS settings.
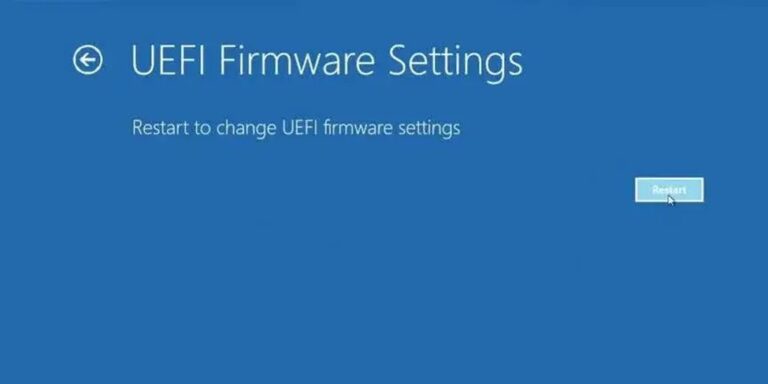
- Now, your PC will ask for your confirmation to restart the system into the BIOS. Click on Restart, and your PC will reboot directly into the BIOS settings.
- Once inside the BIOS/UEFI, use your keyboard to navigate through the menus. Look for a section labeled something like Hardware Monitor, PC Health, or System Monitor—this is where you’ll find your CPU temperature displayed.
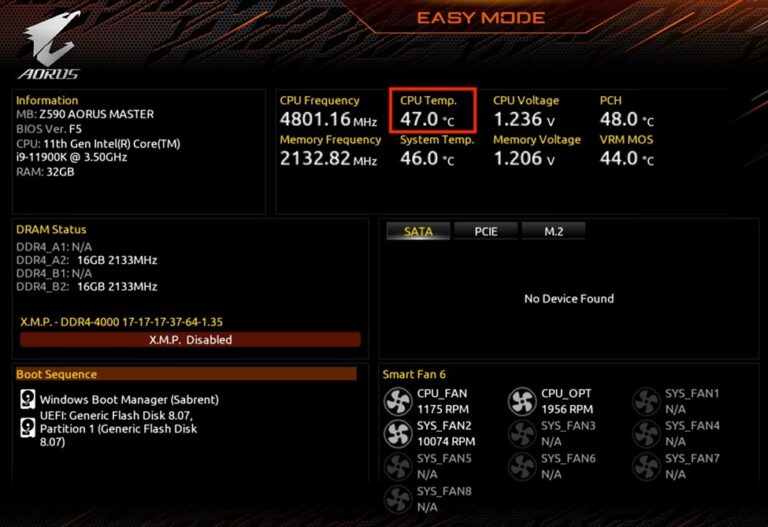
You’ll typically see the current temperature of your CPU listed here, along with other stats like fan speeds and voltage.
Note: Take a screenshot or photo of this screen to compare your temperature over time. However, BIOS/UEFI doesn’t let you monitor the temperature while using your PC—it’s purely for checking at boot.
Tip: The BIOS/UEFI method is the most reliable for temperature readings, but the downside is that you can only access this information when your PC is booting up. If you want to monitor temperatures while using your Computer, you’ll need to use one of the third-party tools we’ll discuss next.
Check CPU Temperature In Windows 11 Using 3rd-Party Software.
By now, you’ve seen that Windows 11 offers a couple of native options to check CPU temperature, but they can be somewhat limited or unreliable. That’s where third-party tools come in. Unlike Windows’ built-in tools, these programs offer real-time monitoring, detailed information about each CPU core, and even additional system diagnostics.
Here are 6 of the best 3rd-party software recommendations you can trust to monitor your CPU temperature.
1. Core Temp
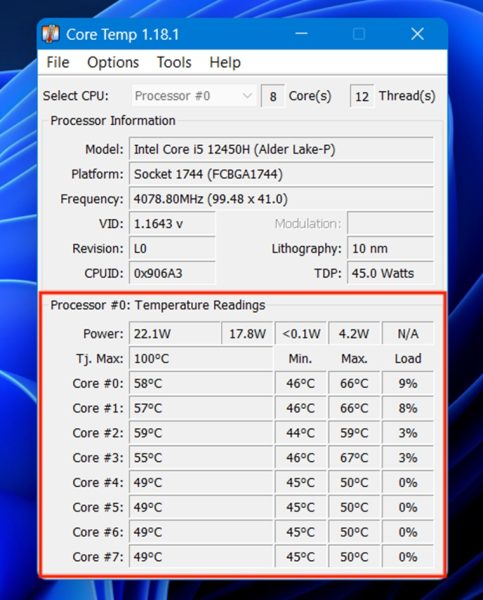
Core Temp is one of the simplest, most lightweight tools for monitoring CPU temperature. It shows the temperature for each CPU core and can be set to display the information in your system tray, so it’s always accessible. Plus, it uses minimal system resources, making it a top choice if you just want a glance at your CPU temperature without extra features bogging you down.
Here’s how to use the Core Temp app:
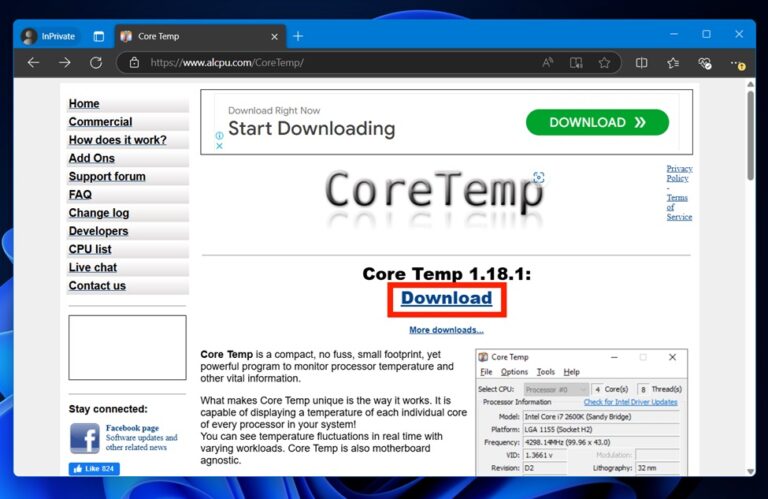
- Visit the official Core Temp website and download the installer by clicking the Download button.
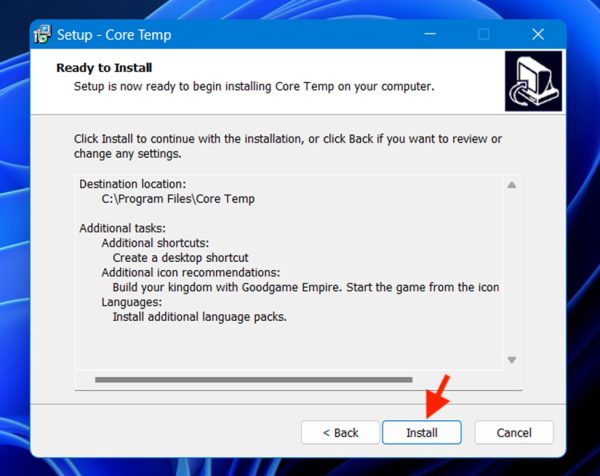
- Run the installer and follow the on-screen prompts to install the program.
- After installation, launch Core Temp. The main window will show you temperature readings for each CPU core under the Temperature Readings section.
You can configure Core Temp to start automatically with Windows and have it display a temperature icon in your system tray. This way, you’ll always know how hot (or cool) your CPU is running without opening the full program.
2. AIDA64
AIDA64 is a robust system information tool that enthusiasts and professionals often use. It offers detailed hardware monitoring, stress testing, and system diagnostics, making it ideal for users who want more than just CPU temperature readings.
Although AIDA64 is not free, it offers a trial period for users who want to explore its extensive features.
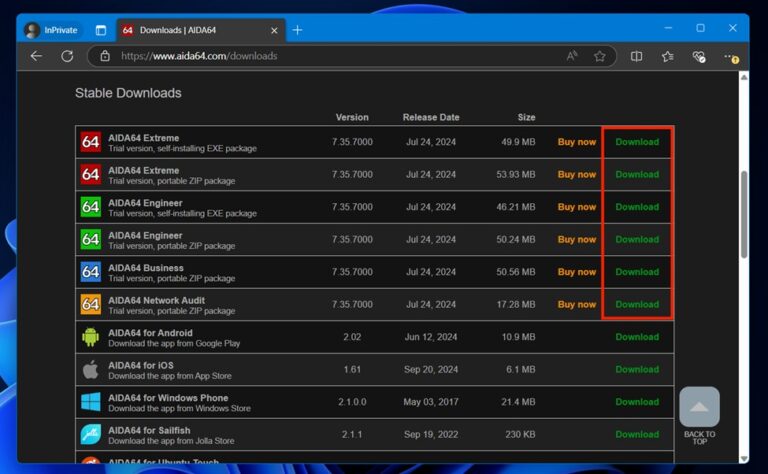
- Go to the official AIDA64 website and download the installer. AIDA64 offers multiple versions (Extreme, Engineer, etc.), so choose the one that suits your needs.
- Run the installer and follow the setup wizard instructions to install the program.
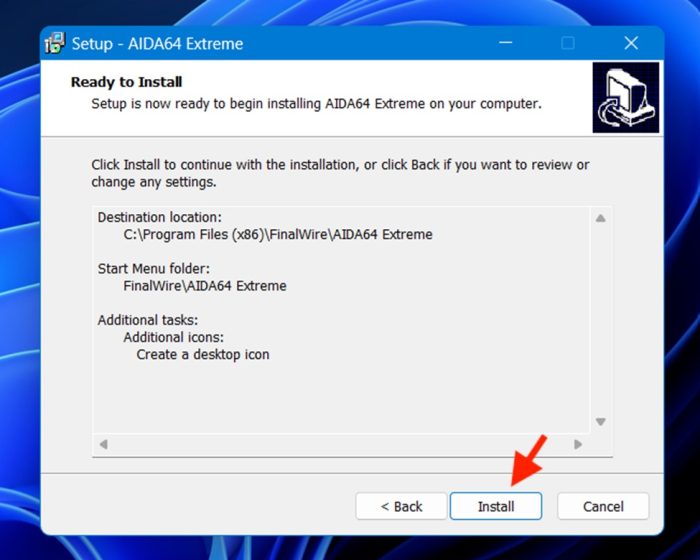
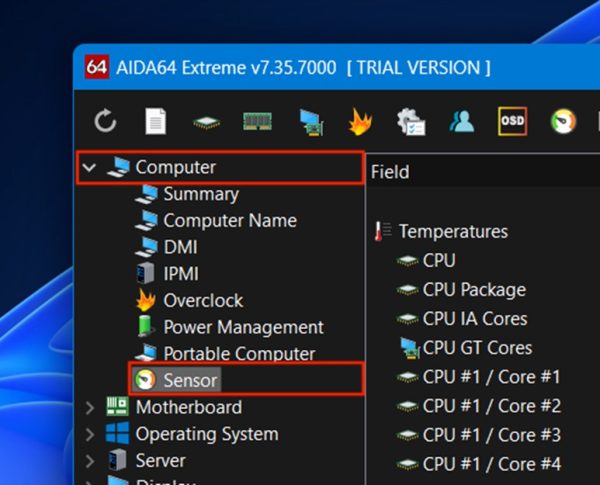
- Once AIDA64 is installed, open the program. In the left-hand sidebar, click on Computer, then select Sensors.
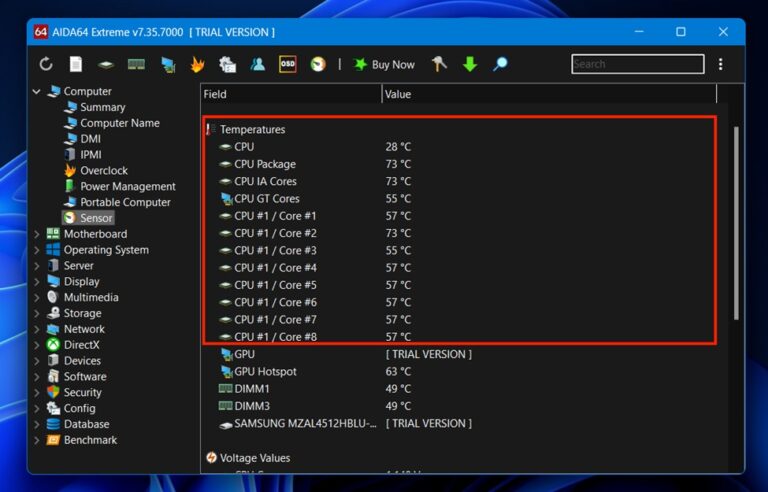
- On the right side, your CPU temperature will show under the Temperatures section, along with a wealth of other sensor data, including fan speeds, voltages, and more.
AIDA64 includes advanced stress tests for CPUs, which can help you determine whether your system is stable under heavy load. This is especially useful for overclockers.
3. HWiNFO
HWiNFO is another comprehensive tool for monitoring various system components. It provides real-time data about CPU temperature and other key metrics, including GPU temperature, RAM usage, and more.
HWiNFO is particularly useful for users who want an all-in-one monitoring solution without the need to download multiple programs.
- Visit the HWiNFO website and download the appropriate version (32-bit or 64-bit, depending on your system).
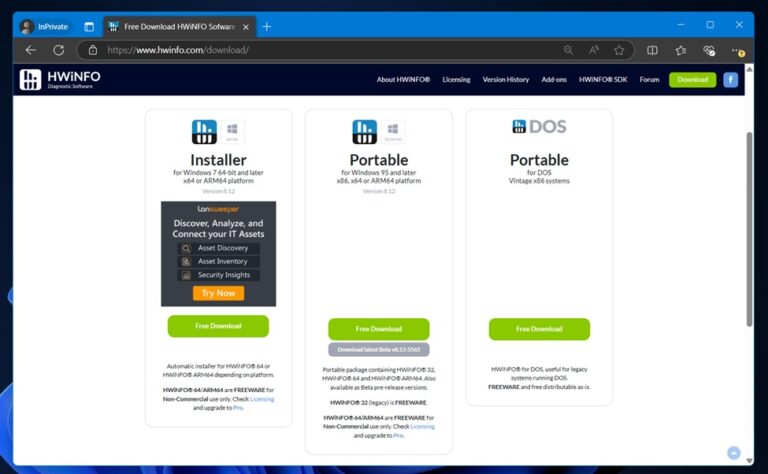
- Run the installer and follow the setup instructions.
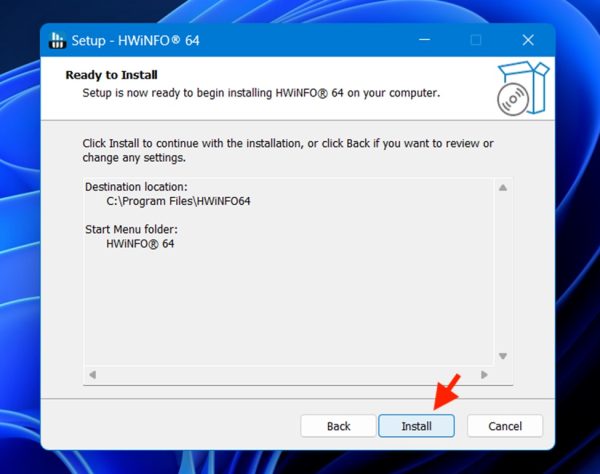
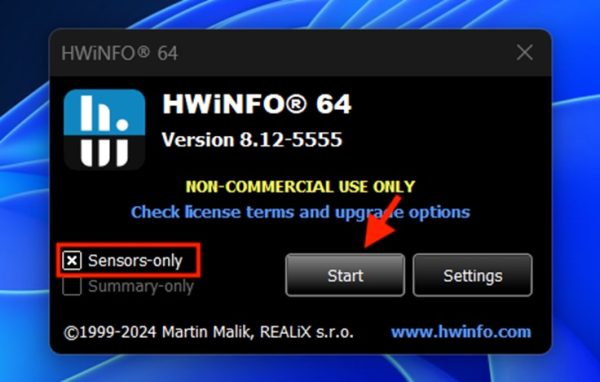
- After installation, open HWiNFO. You’ll be given the option to launch the program in Sensors Only mode, which skips over detailed system info and goes straight to the sensor readings. Select the Sensors-only option and click on the Start button to launch the HWiNFO app.
- Scroll down to find your CPU temperature readings, usually listed under the CPU section.
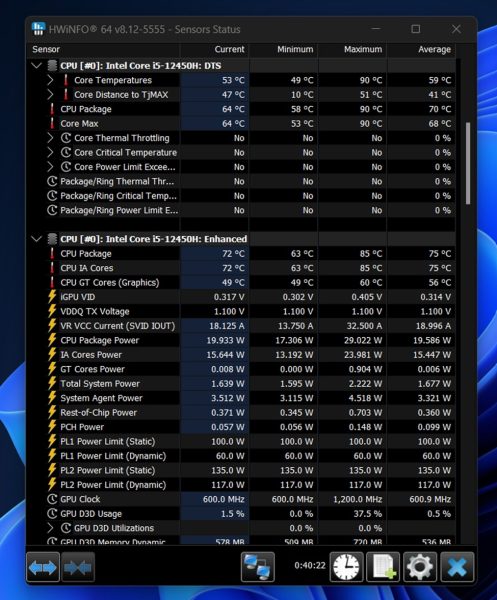
HWiNFO provides reports for almost every piece of hardware in your system, making it an excellent tool for those who want to track their system’s performance in real-time.
4. HWMonitor
HWMonitor is a straightforward, no-nonsense tool for keeping an eye on your system’s vitals. In addition to CPU temperature, it displays fan speeds, voltages, and power consumption. If you want something that covers more ground than Core Temp but is still easy to use, HWMonitor is a great option.
- Go to the official CPUID website and download HWMonitor.
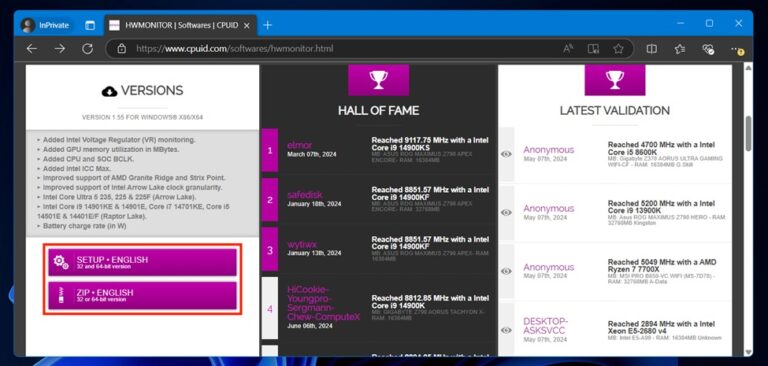
- Run the installer and follow the instructions to install the Software.
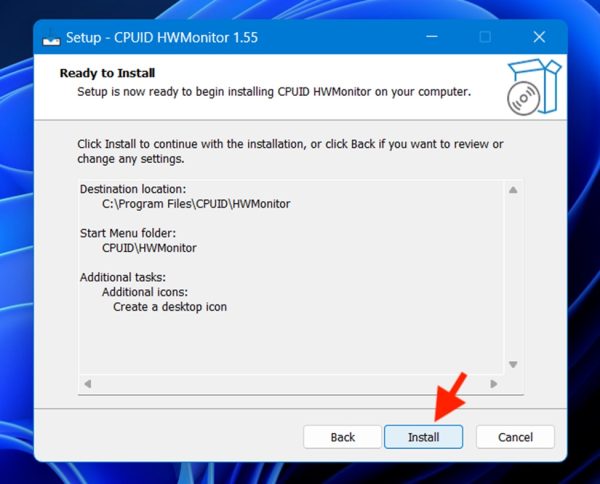
- After launching HWMonitor, you’ll see a list of your system’s hardware. Look for your CPU, click on it, and expand it. The CPU temperature can be found under that CPU section.
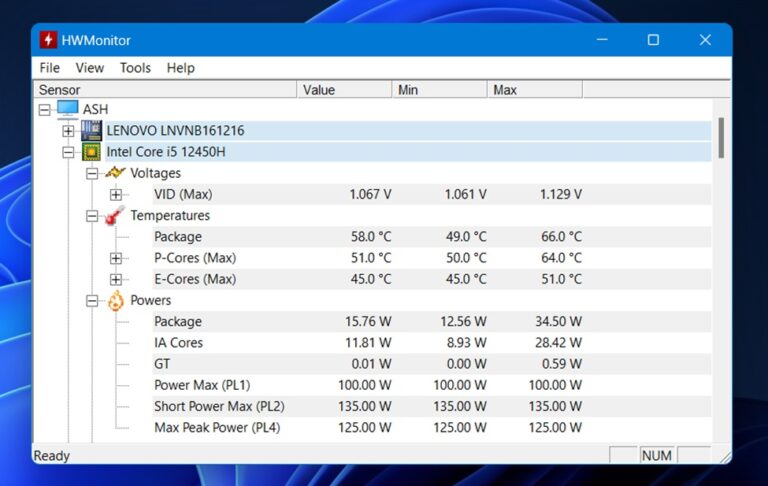
Tip: HWMonitor displays the minimum, current, and maximum temperatures for your CPU during the current session, giving you a better understanding of how your CPU behaves under different loads.
5. Speccy
Speccy is a user-friendly tool that provides a quick system overview, including CPU temperature. It’s perfect for beginners or users who just want a high-level look at their system’s performance. Speccy isn’t as detailed as HWiNFO or AIDA64, but it gets the job done for basic monitoring.
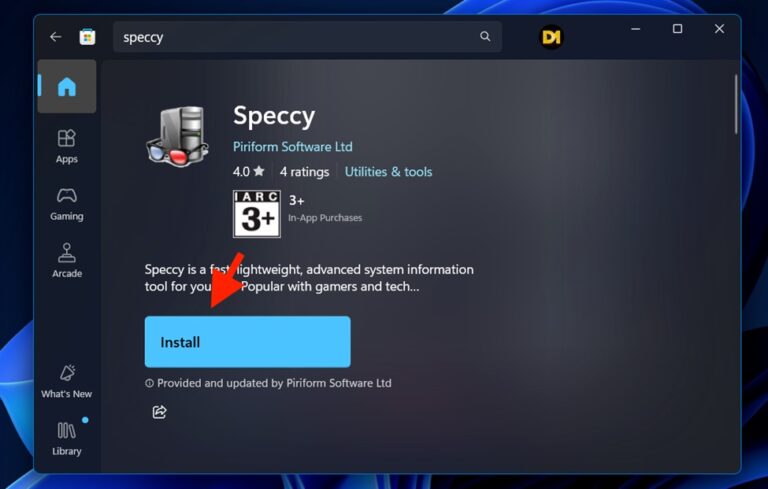
- Download Speccy from the official Microsoft Store.
If you want an alternate way, you can download the Speccy app installer file from the official cCleaner website.
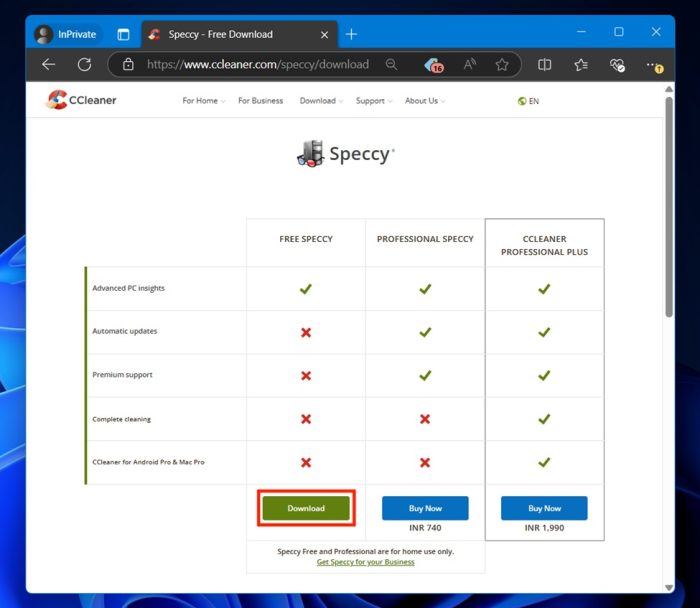
- If you downloaded the installer from the website, launch it and follow the on-screen steps to install it.
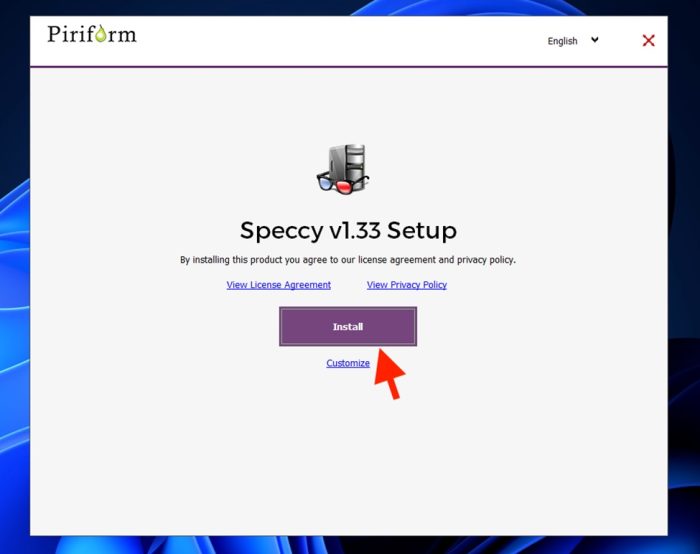
- Once installed, open Speccy. It will take a few moments to analyze your system and display a summary of your hardware.
Click on the CPU tab on the left sidebar to see your CPU’s temperature and each core’s temperature.
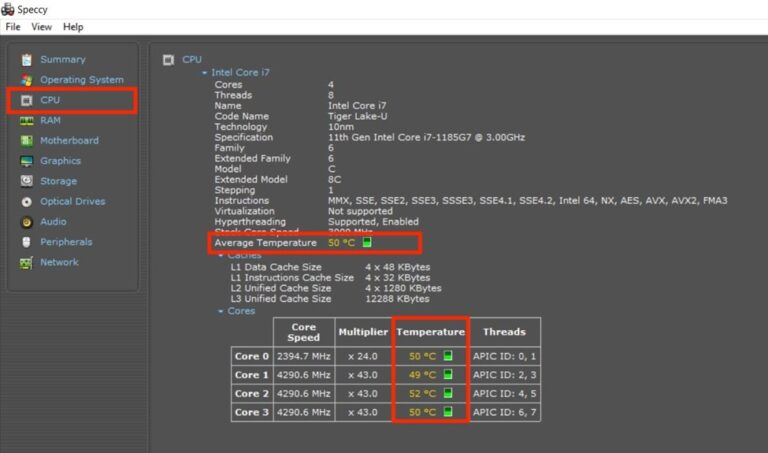
Speccy shows CPU temperature and details about your RAM, GPU, and storage devices, making it a useful tool for a quick system check.
6. Intel Extreme Tuning Utility (XTU)
If you’re running an Intel CPU and want to tweak performance settings, Intel’s Extreme Tuning Utility (XTU) is a must-have. This tool monitors your CPU temperature and lets you adjust clock speeds and voltages for overclocking.
It’s perfect for users with Intel K or X series processors who want more control over their system’s performance.
- Head over to the Intel website and download the XTU installer. Make sure your CPU model is supported by the tool before installing.
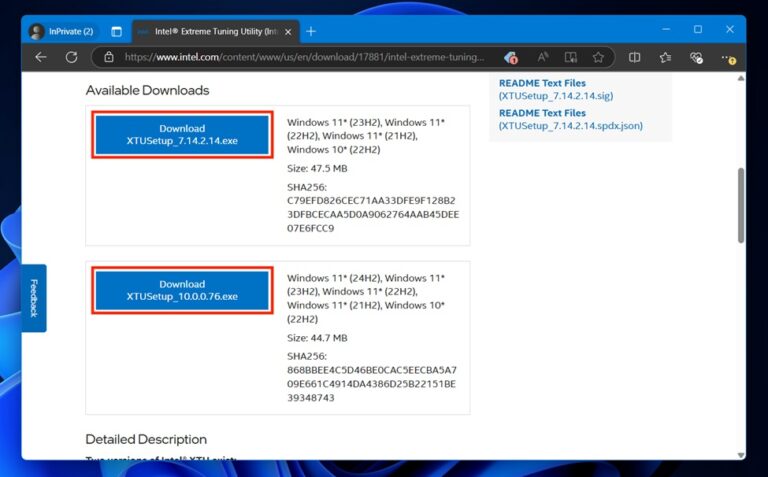
- Run the installer and follow the on-screen instructions to complete the installation.
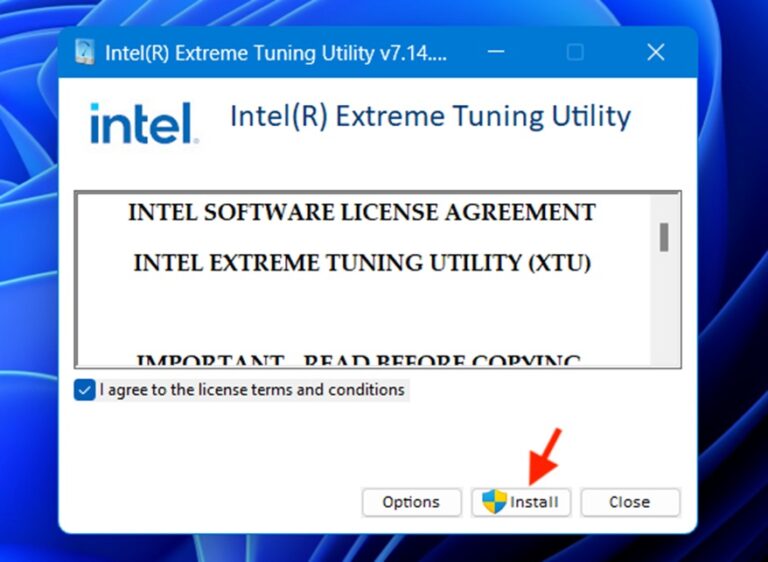
- Once installed, open XTU. The app will launch in a Compact view by default, and you can check your CPU temperature on the right side by the name Package temperature.
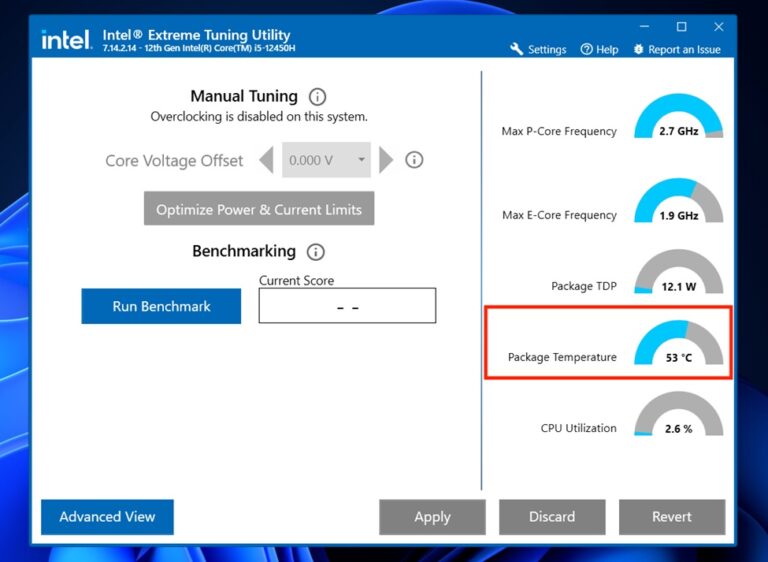
XTU allows users to adjust CPU performance settings in real-time, making it a powerful tool for overclocking and fine-tuning. It’s highly recommended for advanced users with Intel CPUs.
Conclusion
I have walked you through multiple methods for checking CPU temperature in Windows 11 – from, built-in options like using PowerShell commands and BIOS/UEFI settings to more feature-rich third-party tools such as Core Temp, HWiNFO, and Intel XTU.
For gamers and power users, regularly checking your CPU temperature is essential for maintaining peak performance and extending the life of your hardware. A system running too hot can result in crashes, throttling, or even permanent damage. By keeping an eye on those numbers, you ensure your PC stays cool under pressure.
Frequently Asked Questions (FAQs)
Your CPU is the brain of your Computer, and just like our brains, it doesn’t perform well under heat stress. Overheating can cause a range of issues, from decreased performance and unexpected shutdowns to permanent damage to your hardware. Monitoring your CPU temperature helps you prevent these problems, especially during demanding tasks like gaming, rendering, or video editing.
A CPU typically operates safely within the range of 40°C to 70°C under load. Temperatures higher than 80°C can lead to thermal throttling, where your CPU deliberately slows down to avoid damage. If your CPU temperature regularly spikes above 90°C, you’re looking at potential long-term harm and should consider improving your cooling setup
Unfortunately, there’s no direct way to check your CPU temperature in Windows 11 without accessing the BIOS/UEFI or using third-party Software. Windows Task Manager doesn’t offer this feature, but PowerShell commands or your BIOS can give you basic temperature readings—though third-party tools are far more reliable for real-time monitoring.
If you’re a gamer, you’ll want a tool that gives you detailed stats and performance controls. HWiNFO and Intel’s Extreme Tuning Utility (XTU) are excellent choices. HWiNFO offers in-depth monitoring of all system components, while Intel XTU allows gamers to tweak system performance and monitor temperatures, which is especially helpful for overclocking enthusiasts.
Yes, overclocking pushes your CPU to run faster than its base clock speed, generating more heat. This increases the risk of overheating, which is why monitoring your CPU temperature becomes even more critical if you’re overclocking. Using a tool like Intel XTU or HWiNFO will help you closely monitor temperatures to ensure your system remains stable during those performance boosts.

