
Analyzing your website for things to improve can be challenging. Between SEO, conversions and traffic, there’s a lot to consider. Fortunately, Google Analytics reports offer detailed insight into your website so you can make informed decisions to improve its performance.
This guide will go through the six reports in Google Analytics that every business needs in 2021. These include the mobile overview, website speed, goals, channels, navigation summary, and landing pages.
What is a Google Analytics report?
Google Analytics reports are a powerful tool to view and track a collection of Google Analytics data using specific themes. These themes include acquisition, engagement and conversion. Google Analytics reports also include two types of data: metrics and dimensions.
Why is Google Analytics important?
Google Analytics is important because it allows businesses to understand how their website is performing. They can then make informed decisions about what they want to improve. Businesses can view key performance metrics, including:
- Problems users when visiting your website via mobile
- Check website speed and solve any page load-time issues
- Track conversions compared to your business goals
- Choose the best channel to generate traffic
- Understand what users are searching using your internal search
- Improve your website UX for a better customer experience
The top six Google Analytics reports
1. Mobile Overview Report
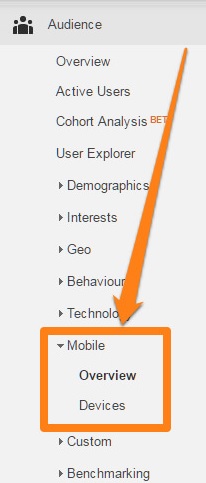
The Mobile Overview report helps site owners recognize problems users experience when visiting their site through mobile devices. For example, not having a mobile-friendly website forces your audience to find other “more mobile-friendly” alternatives. Plus, Google will penalize you by decreasing your site’s ranking for not being compatible with mobile.z
Why do you need a Mobile Overview report?
The Mobile Overview report allows you to see what devices people use to view your website through a mobile device. Likewise, you can see the channels your visitors are coming from. With all these facts gathered, you can improve your site’s mobile experience to magnify ranking and traffic.
How to access the Mobile Overview report in Google Analytics?
Audience -> Mobile -> Overview
2. Site Speed Overview Report
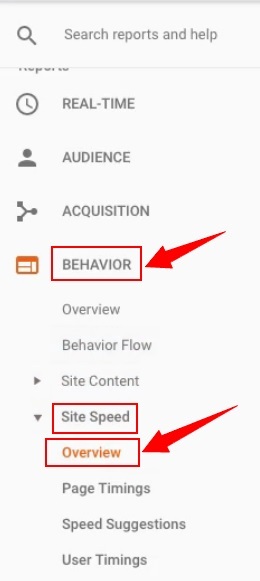
With the Site Speed Overview report, you can see how your website’s speed is performing over time. The report can also tell you which site pages have a slow load time and why. Using this same option, you can also see Google Analytics suggestions to enhance speed.
Why do you need a Site Speed Overview report?
The Site Speed Overview report shows how quickly your website pages load from various perspectives, such as different countries and different browsers. You can also see the user-interaction speed and the website’s response time.
For example, how quickly does the website respond when a user clicks on a button. Moreover, you can also find how fast the browsers parse the document and show it to the users for interaction.
How to access the Site Speed Overview report in Google Analytics?
Behavior -> Site Speed -> Overview
3. Goal Overview Report
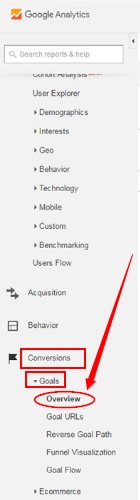
The Goal Overview is indeed one of the important Google Analytics SEO reports. You can track the insights of any business goal with this report. For instance, you can check the number of sign-ups to your newsletter or downloads of a specific file.
Why do you need a Goal Overview report?
Using a Goal Overview report allows you to see which pages generate more conversions. With this, you can also view the channels and fix time frames to analyze goals. As a result, you can compare recent insights with historical data and see whether you met your business goals.
How to access the Goal Overview report in Google Analytics?
Conversions -> Goals -> Overview
4. Channels Report
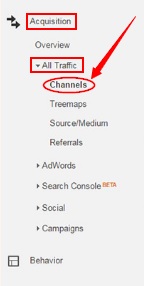
Your website traffic comes from different channels, and this report informs you if that traffic is coming from paid or unpaid channels. For example, you can see whether or not visitors come through referrals, social media or organic search.
Why do you need a Channels report?
Through the Channels report, you can see the number of visitors the website had, the duration they stayed on a page, and whether or not there were conversions. All these statistics help you choose the right channels. If the traffic is low or the bounce rate has increased over the years, you can do modifications to fix the issues.
How to access Channels report in Google Analytics?
Acquisition -> All Traffic -> Channels
5. Navigation Summary Report
Navigation Summary allows you to see common paths users take to visit URLs on your website. To start, you choose a date range and specify a URL that you want to analyze. The report also shows what websites users visited before visiting your site and where they went after leaving.
Why do you need a Navigation Summary report?
The collection of information from the Navigation Summary is beneficial in many ways. First, you can start to see common navigation patterns for users. Second, you can learn about the pages and paths to optimize or add shortcuts to help with navigation.
Another advantage of this report is that it will enable you to discover the users’ concerns. For example, if they are moving back and forth between a few common website pages, some information may be missing, and they’re trying to find it somewhere else.
Once have insight into this data, you’ll be able to optimize pages to prevent them from visiting your competitor’s website to find the answers.
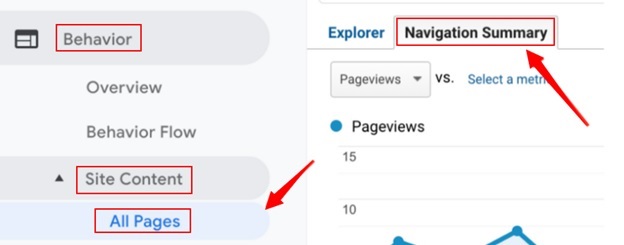
How to access the Navigation Summary report in Google Analytics?
Behavior -> Site Content -> All Pages -> Navigation Tab
6. Landing Pages Report
The Landing Page report can show you the pages where visitors land first and where they found the website. You can also see the number of goal conversions since the user lands on the first page of your website. Additionally, you can also know the number of users who leave instantly after coming to the page.
Why do you need a Landing Pages report?
Since the report tells you the immediate bounce rate from a particular page, you can quickly improve the load time or make it more engaging to enhance user interaction.
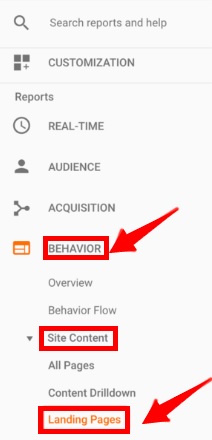
How to access the Landing Pages report in Google Analytics?
Behavior -> Site Content -> Landing Pages
Final Thoughts
Reports in Google Analytics are great for understanding how your website performs against your business goals. Using the data found, you can learn about common problems and come up with effective solutions. Plus, it’s an authentic tool to know ways to increase organic traffic, turn potential customers into repeated customers, and make the overall design of your website unique and appealing.
